

The US-China Trade Dispute And its Impact on Exports
The US-China trade dispute has escalated since mid-June,with the two countries ratcheting up their import tariffs. The US announced the first round of tariff hikes on June 15,imposing a 25% duty on US$50 billion worth of Chinese goods. A day later,China responded with countermeasures of equal scale. Threatened tariffs on $34 billion of Chinese imports went into effect on July 6,and the remaining US$16 billion was implemented on August 23. The US imposed another tariff of 10% on $200 billion worth of imported Chinese goods,a move that was followed by China's imposition of tariffs ranging from 5%-25% on $60 billion of imports from the US.
Plans by both sides to impose more punitive tariffs have been put on hold but there is no resolution to the underlying problems.
What effects can we see from the trade dispute? Chinese and US trade statistics for the first eight months of the year can provide some clues.
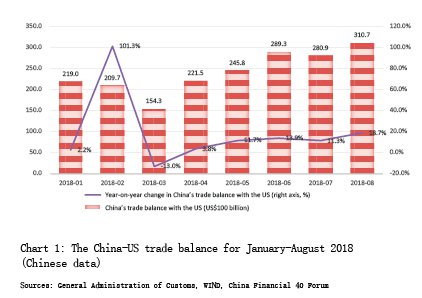
If we look at the trade balance,China sustained less damage than the US. According to Chinese data,China had an overall trade surplus of US$169.7 billion over the January-August period this year,down 26.4% from the same months last year. During the same eight-month period this year it had a US$193.1 billion surplus with the US,up 13.8% from a year earlier. The increase was especially obvious since the official outbreak of the dispute in mid-June. China's trade surplus with the US maintained double digit growth year on year over the June-August period,expanding 13.9% in June,11.3% in July,and 18.7% in August year on year. The monthly surplus was US$28.9 billion in June,US$28.1 billion in July and US$31.1 billion in August. These were the highest levels for the year at that point (see Chart 1),with August setting a new record.
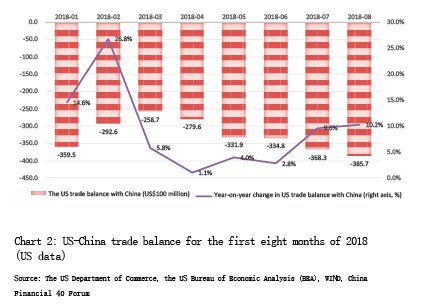
According to US statistics,the US had an overall trade deficit of US$573.9 billion in the first eight months of this year,up 8.4% over the previous year. Its deficit with China was US$261.1 billion,up 9.0% from a year ago,contributing 45.5% of the total US deficit (up 0.2 percentage point from the same period last year) and 48.1% of the total increase during the period. The monthly trade deficit with China maintained year-on-year growth between June and August,rising 2.8% to US$33.5 billion in June,9.6% to US$36.8 in July and 10.2% to US$38.6 billion in August (see Chart 2). These were the three biggest deficits of the year (as of that month) and August was a record high.
There are two possible explanations for the increased trade imbalance with China. One is that companies in China were trying to speed up their exports ahead of the imposition of further tariffs. The other is that the impact of the tariff increase was partially offset by accelerated economic growth,stronger domestic demand as a result of tax reform in the US and the appreciation of the dollar. The statistics from the two countries suggest that the latter explanation is more likely.
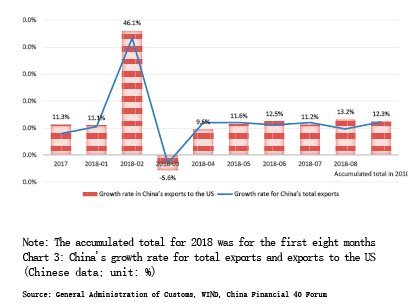
According to Chinese statistics,China's exports overall rose 13.0% year on year during the January - May period,while exports to the US were up 12.3%. Exports overall in July and August combined rose 11.0% year on year,while exports to the US were up 12.3% (see Chart 3). It is reasonable to conclude that the increase in China's exports to the US from June to August resulted from enterprises attempting to speed up exports to avoid punitive tariffs. However,the growth rate in China's exports to the US for the first eight months was up 12.3%,roughly equal to the accumulated rise of 12.2% year on year in China's total exports for the same period (see Chart 3). In 2017,China's exports to the US rose 11.3% ¨C far higher than the 7.9% average growth rate of the country's total exports (see Chart 3). These figures don't support the first explanation.
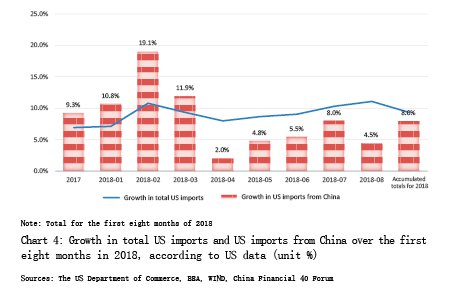
Similarly,US statistics do not show an acceleration of imports from China. According to US data,total imports rose 9.3% year on year over the first eight months,1.3 percentage points higher than the 8.0% growth in imports from China (see Chart 4). Over the first five months of the year,US imports from China rose 9.4%,outpacing the rise in imports overall of 8.8%. But from June to August,US imports from China were up 6.0%,4.2 percentage points below the 10.2% increase in total imports (see Chart 4). If companies in the US were speeding up their imports,this should have been evident earlier in the year. But US imports from China didn't rise faster than the average growth rate in total imports. Moreover,it was widely known that any increase would not be made until the end of May.
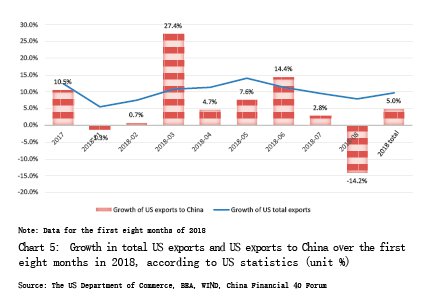
Furthermore,if Chinese enterprises were in fact speeding up their exports to the US in an effort to beat the new and higher tariffs,wouldn't it be likely that US enterprises tried to do the same thing with their exports? In fact,US exports to China increased by only 0.5% from June to August,9.1 percentage points lower than the growth in exports overall in the same period and 7.3 percentage points lower than th