

Will the Fed's Quantitative Easing Lead to High Inflation?
Unprecedented stimulus policies have been taken by the United States in response to the Covid-19 pandemic and these have led to a dramatic expansion of the Federal Reserve's balance sheet and the fiscal deficit. One big concern is whether these measures and the restarting of the economy will lead to high inflation. Since the financial crisis in 2008,four rounds of Quantitative Easing (QE) have been initiated by the Federal Reserve,without creating much higher M2 growth rate or high inflation. But the unlimited QE policy initiated by the Federal Reserve this time has pushed the year-on-year M2 growth rate to a new historic high. Why is it different this time? Will high M2 growth result in high inflation? Will there be other factors that contribute to high inflation in the future?
Causes of High M2 Growth
Base currency refers to the total cash held by the public and circulating outside the banking system as well as the reserves held by the central bank against deposits in the commercial banking system. It is also called high-powered money,since it has the capacity to enlarge or shrink total currency substantially. It is provided by the central bank and released when the central bank's balance sheet is expanded. Through the money multiplier,base currency can be expanded to broad money (M2),so the enlargement capacity of base currency is determined by the money multiplier.
Since the 2008 financial crisis,the Federal Reserve has launched four rounds of QE,enlarging the Fed's balance sheet by 4.6 times from US$0.97 trillion in September 2008 to US$4.46 trillion at the end of 2014. However,over the same period the average year-on-year CPI growth was only 1.65%,showing no high inflation from this unlimited QE. To cope with the economic shock of Covid-19,the Federal Reserve's balance sheet was expanded once more in 2020,with the total of assets and liabilities increasing from US$4.13 trillion in February to US$7.09 trillion in June. Nevertheless,unlike in 2008,the year-on-year M2 growth rate during this period of QE reached a record new high in May at 23.14%,the highest level since 1960. In comparison,the highest year-on-year M2 growth rate was only about 10% during the QE of 2008. Why was it different this time?
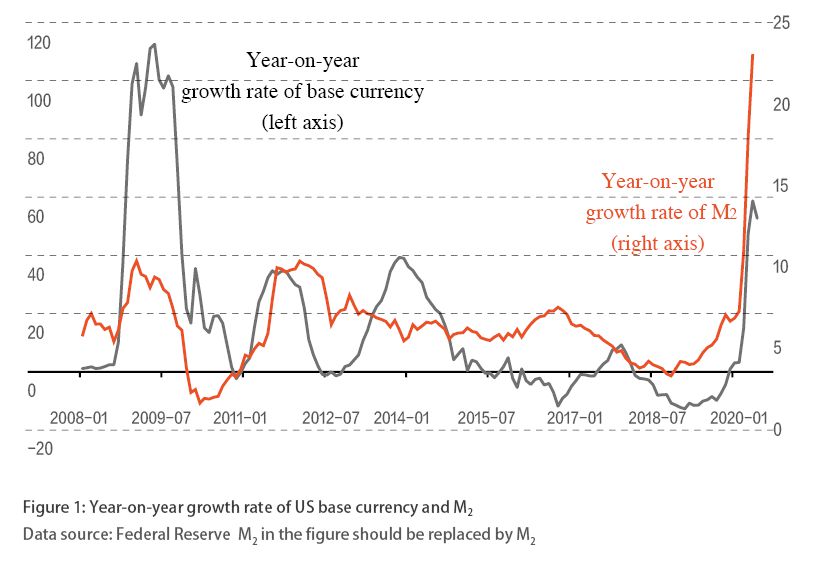
In 2009,the year-on-year growth rate of US base currency broke through 110% at its peak,while the corresponding year-on-year M2 growth rate was only around 10%. However,in May 2020,the year-on-year growth rate of US base currency approached 60%,while the corresponding year-on-year M2 growth rate exceeded 20% (Figure 1). This huge contrast is mainly a result of the changes in the money multiplier (Figure 2). According to the exogenous determination theory of money multiplier (Milton Friedman,Anna Schwartz,and Jerry Jordan),of which M2 is broad money supply,B is base currency,and M2 is the money multiplier between M2 and B. Obviously,while M2 drops rapidly,the rapid enlargement of base currency will not lead to high M2 growth rate. From 2008 to 2014,M2 fell rapidly; it fell from 9.12 in August 2008 to 2.88 by the end of 2014. This is the reason why the last round of QE did not lead to a high M2 growth rate. However,although M2,the money multiplier,declined in 2020,the drop was limited,not enough to offset the rapid enlargement of base currency and thereby resulting in relatively high M2 growth subsequently.
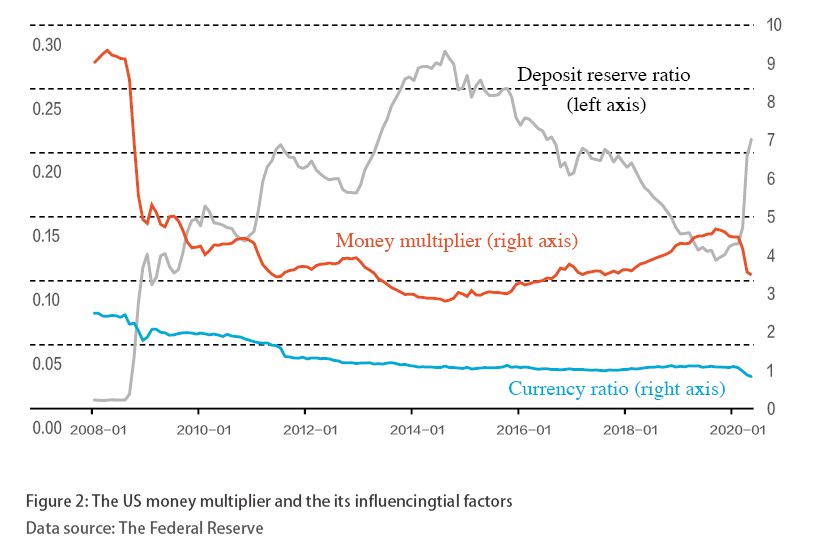
In future,there is still room for a slight drop in the money multiplier. According to money multiplier theory,the three main variables affecting the money multiplier are: the statutory reserve ratio,the excess reserve rate,and the currency ratio. All these three variables are negatively correlative with money multiplier. To be specific: (1) The statutory reserve ratio is not a major factor affecting the US money multiplier. In fact,the US statutory reserve ratio has always been relatively low; it was 0.6% in 2008,followed by a gradual rise to 1.6% at its peak before declining to 0 in March 2020. (2) The excess reserve ratio is also a major factor affecting the US money multiplier. In early 2008,the US excess reserve ratio was less than 1%. However,during the successive rounds of QE initiated by the Federal Reserve,commercial banks did not allocate all base currency to the real economy but instead kept a large quantity of funds in accounts with the central bank. As a result,the US excess reserve ratio approached 24% by late 2014. This was the major reason why the US money multiplier dropped in the last round of QE. From 2020,the US excess reserve ratio rose rapidly again from 11.3% in February to 21.1% in May,indicating the growing reluctance to lend among commercial banks. (3) The currency-deposit ratio also has an impact on the money multiplier. It is defined as the ratio between currency in circulation and current deposits at commercial banks. In the last round of QE,the US currency-deposit ratio dropped markedly from 2.4 in August 2008 to 1 by the end of 2014,supporting the money multiplier to a certain extent. Since the onset of the Covid-19 pandemic,the US currency-deposit ratio has fallen again,dropping from 1.1 in February to 0.8 in May 2020. This might be affected by the large quantity of relief payments from the government and the sharp drop in consumption during the outbreak of the pandemic (Figure 2).
On the whole,since there is a relatively high level of uncertainty in the economy,there's still room for the US excess reserves ratio to rise to the peak seen during the last round. On the other hand,as the currency-deposit ratio is affected by savings and spending habits,there is a great deal of resistance to a sharp fall in the currency-deposit ratio in the short term. Therefore,if the Federal Reserve's balance sheet continues to expand,the money multiplier may fall,but it is unlikely to fall to the same extent as in 2008.
Changes in Currency Supply
According to the Fisher Equation,MV=PT,of which M represents the amount of currency in circulation,V refers to the speed of currency circulation,P is the general price level,阅读全部文章,请登录数字版阅读账户。 没有账户? 立即购买数字版杂志