

What Drives Cross-Border Portfolio Flows?
Authro: Gene MA, Phoebe FENG and Andrew LOEVINGER
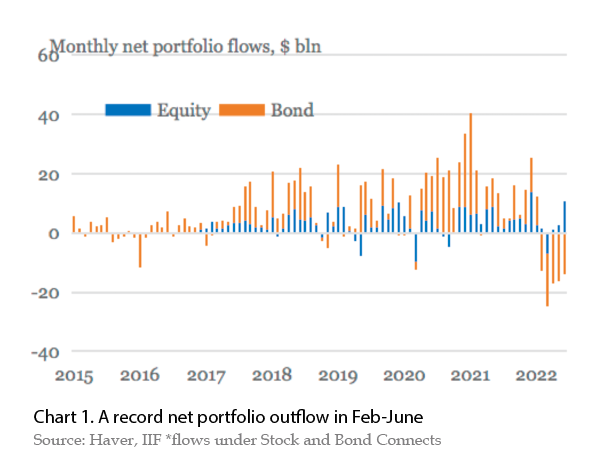
Portfolio investment flow to China is a weathervane for China's financial health and global investor confidence. Chart 1 shows the capital flows via the Stock and Bond Connects in February-June. We studied the forces that drive China's net bond and equity flows. It shows that relative economic growth,bond yields,RMB exchange rate,market volatility,and index inclusion explain about 50% of the flows (Chart 2). Many other factors,such as policy and geopolitical risk,which are hard to quantify,are also behind the ebb and flow of portfolio investments.
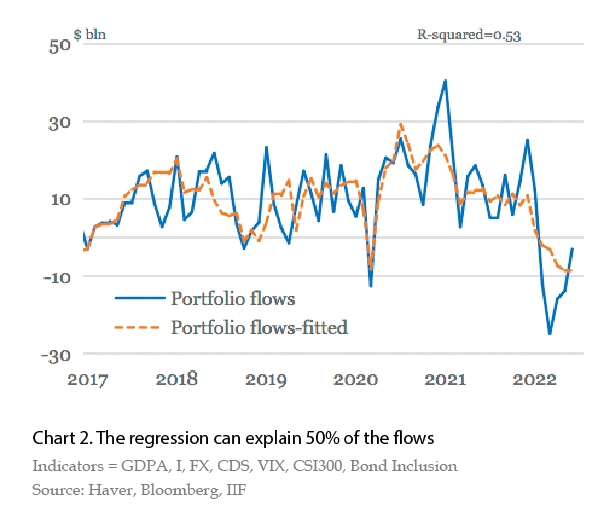
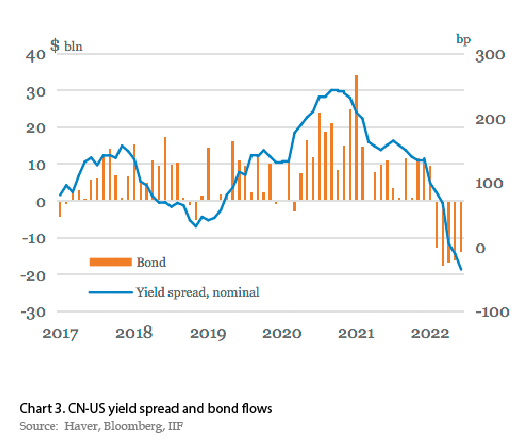
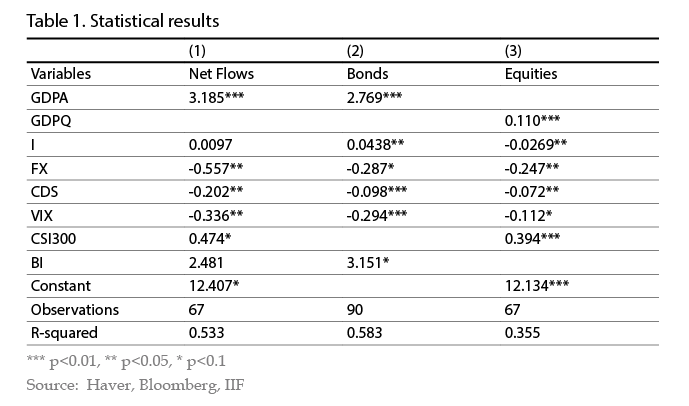
We regressed monthly portfolio flows since January 2015 on yield spread (CNY and USD 10Y sovereign yields),expected CN-US GDP growth differentials,the RMB exchange rate,China sovereign CDS (credit default swap) spread,VIX (CBOE Volatility Index),CIS300 stock index,and bond index inclusions. In these regressions,we chose flows under the Bond and Stock Connects instead of the BOP data because the former is monthly while the latter is quarterly. Moreover,the about 15% or so flows captured by the BoP but not by Connects are mostly those under QFII/RQFII programs,the timing of which indicates more about quota approval than actual asset allocation. All the independent variables in our regressions are statistically significant and show the expected sign directions (Table 1). Regressions for bond-only flow achieved a slightly better R-square (0.58) than for bond and equity combined. This is likely because bond investments are more macro-driven.
The many forces behind the flows
To better compare the variables,we standardized the result and calculated how much portfolio flows would be caused by one sigma change in the variables (Table 2).