

The Chinese Government's Leverage Rises to All-Time High While Private Sector...
Title: The Chinese Government's Leverage Rises to All-Time High While Private Sector Began to Repair its Balance Sheet
Author: ZHANG Xiaojing, LIU Lei and CAO Jing
In the first quarter of 2025, China's macro leverage ratio surged by 7.8 percentage points to 298.4%, making it the highest single-quarter increase in nearly a decade. The government leverage ratio hit a new two-decade high, a trend that has actively supported the repair of private-sector balance sheets and fueled a robust economic rebound at the start of this year. Meanwhile, the household sector has shifted from deleveraging to leverage stabilization, while the corporate sector showed a tendency to increase leverage. These developments collectively underscore the effectiveness of macroeconomic governance innovation based on national macro balance sheet management.
Debt Expansion and Nominal Growth Stabilization Drive Sharp Rise in Macro Leverage Ratio
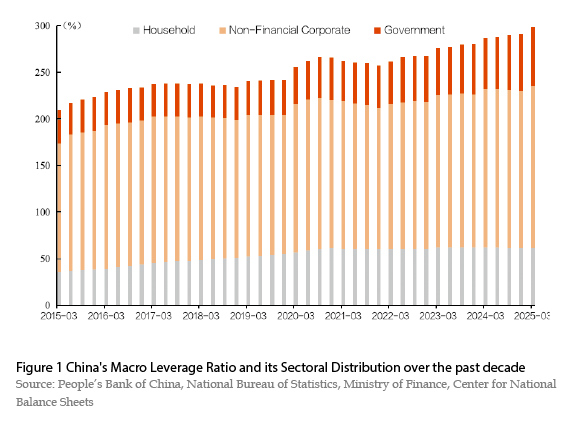
In the first quarter of 2025, China's macro leverage ratio increased significantly by 7.8 percentage points, rising from 290.7% at the end of 2024 to 298.4%, which saw the largest single-quarter increase since 2015 (excluding the first quarter of 2020). Sectorally, the household leverage ratio edged up 0.1 percentage points from 61.4% at the end of 2024 to 61.5%; the non-financial corporate leverage ratio increased by 5.3 percentage points from 168.4% at the end of 2024 to 173.7%; and the government leverage ratio increased by 2.4 percentage points, from 60.9% at the end of 2024 to 63.2%. Under the impetus of more proactive fiscal policies, private sector balance sheets have shown renewed recovery signals, with household leverage ratio stabilizing and non-financial corporate leverage ratio growing rapidly.
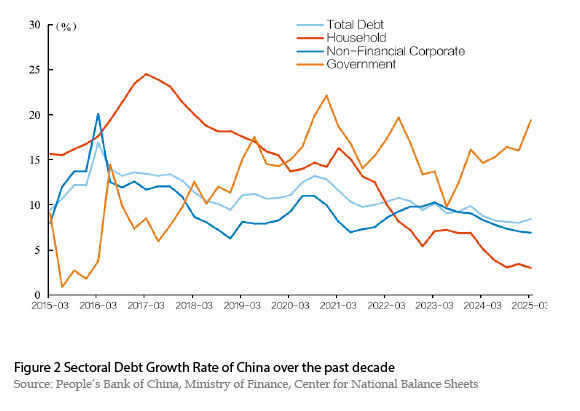
Early-effect fiscal stimulus and marginal credit recovery lift real economy debt growth. In the first quarter of 2025, the real economy debt growth edged up to 8.4% from 8.0% at the end of 2024. The household debt growth rate decelerated from 3.4% at the end of 2024 to 3.0%, indicating persistent weakness in consumption and mortgage leverage that requires further policy support. The non-financial corporate debt growth rate slowed from 7.0% at the end of 2024 to 6.9%, constrained by weak financing demand, especially for medium- and long-term credit and bond financing. Fiscal policies have become more proactive and taken effect early, with the government debt growth rate rising sharply from 16.0% at the end of 2024 to 19.4%, effectively underpinning infrastructure investment and accelerating debt swaps of local governments' implicit liabilities.
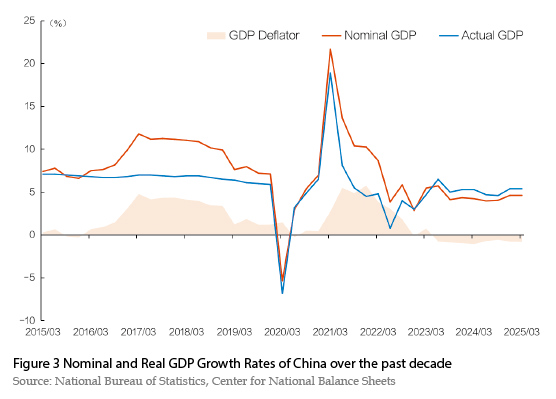
The growth rate of nominal economy rebounded from its low, easing the pressure on the passive rise of the macro leverage ratio. The package of incremental policies introduced in September 2024 has been effectively implemented, with policy measures further strengthened and expanded in 2025, jointly fostering a robust economics for China. The real GDP growth rate in the first quarter was 5.4%, while nominal GDP grew by only 4.6%. The gap between nominal and real GDP growth rates--the GDP deflator—stood at -0.8%, remaining negative for eight consecutive quarters since the second quarter of 2023. This indicates the need for serious attention to sustained low price pressures. From the perspective of the denominator of the macro leverage ratio, the nominal GDP annualized growth rate on a rolling basis was 4.3%, a 0.08 percentage point increase from 2024 figure, slightly easing the passive upward pressure on the macro leverage ratio caused by weak nominal GDP growth.
Household Leverage Ratio Stabilizes after Year-Long Decline
In the first quarter of 2025, the household leverage ratio increased by 0.1 percentage points, from 61.4% at the end of 2024 to 61.5%. Supported by policies to boost consumption and stabilize the real estate market, trade-ins of consumer goods and service consumption grew rapidly, and the real estate market heated up in core cities, which led to a shift from household deleveraging to leverage stabilization.
The growth rate of total household debt fell to 3.0%, a decrease of 0.4 percentage points from the end of 2024. Among them, the growth rate of consumption loans (including mortgages and general consumer loans) was 1.6%, an increase of 0.3 percentage points from the end of 2024; while the growth rate of business loans was 6.5%, a further decrease of 2.6 percentage points from the end of 2024. Since the second quarter of 2023, household mortgages have experienced negative growth for seven consecutive quarters. With the continuous policy efforts to stabilize the real estate market, the mortgage decline narrowed from -2.2% in the third quarter to -1.3% at the end of 2024. It is estimated that the mortgage decline further narrowed to -0.7% in the first quarter of 2025, while general consumer loans grew at a rate of 5.9%.
Increasing housing transaction volumes and stable prices supported a narrowing decline in household mortgage loans during the first quarter of 2025, signaling further stabilization in China's real estate market. In terms of transaction volume, housing demand has steadily improved. The sales of newly-built commercial housing fell 2.1% in value, representing significant improvements from 2024 with declines narrowing by 9.9 and 15.0 percentage points respectively. The second-hand housing market outperformed newly-built commercial housing, emerging as the primary driver of market recovery. In terms of transaction price, housing prices in first- and second-tier cities stabilized after reaching earlier bottoms. In March 2025, the sales price of newly constructed and second-hand commercial residential buildings in 70 medium- and large-sized cities decreased respectively by 5.0% and 7.3% respectively, with the decline narrowing for five consecutive months. In first-tier cities, both newly constructed and the second-hand housing prices continued to rebound, while the second-hand housing market has taken the lead in recovering. Second-tier cities experienced a turnaround in newly-built commercial housing prices (month-on-month growth turned positive), stabilizing ahead of the second-hand housing market. Currently, newly constructed housing transactions are mainly driven by upgrading demand, with a higher share of large-sized and premium properties. However, second-hand housing transactions are dominated by low-price and small-sized units, serving as the primary channel for first-time homebuyers.
Excluding the drag of negative mortgage growth, it is estimated that the growth rate of general consumer loans in the first quarter of this year was 5.9%, mainly due to the rapid growth of consumer goods trade-ins and service consumption. On the one hand, to further boost domestic demand and spur economic growth, China has expanded the scope for eligible government subsidies for the consumer goods trade-in program. In the first quarter of 2025, the retail sales of communication equipment, cultural and office supplies, household electrical appliances and audio-visual equipment, and furniture increased respectively by 26.9%, 21.7%, 19.3%, and 18.1%, contributing 30.4% to the growth of total retail sales of consumer goods. On the other hand, compared with trade-ins of consumer durables, service consumption is less likely to overdraw future consumption capacity and is conducive to absorbing more jobs. The per capita service consumption expenditure of residents grew by 5.4% in the first quarter, accounting for 43.4% of total per capita consumption expenditure. Notably, the development-oriented consumption related to consumption structure upgrading grew even faster, with residents' expenditures on education, cultural and entertainment services, and transportation and communication expenditures increasing by 13.9% and 10.4% respectively.
From the flow and stock analysis perspective, boosting consumption hinges on increasing residents' income and wealth accumulation. In terms of income flow, residents' per capita disposable income rose by 5.6% (excluding price factors), roughly synchronized with GDP growth. As real estate and capital markets stabilized and rebounded, the growth rate of residents' income from properties picked up significantly, while wage and operating income maintained steady growth. In terms of wealth stock, asset appreciation and stock market gains have driven wealth growth, making residents' income expectations more optimistic, thereby reducing precautionary savings and enhancing consumption confidence. With the real estate market's continuous recovery, the rise of DeepSeek has initiated a new round of technology cycle, sparking a reassessment of Chinese assets and accelerating foreign capital inflows into Chinese technology stocks. Stabilizing the housing and stock markets helps to accelerate the recovery of household balance sheets, thus enhancing consumption capacity and boosting consumer confidence, which supports the stabilization of household leverage ratio.
Non-Financial Corporate Leverage Ratio Has Significantly Increased
In the first quarter of 2025, the non-financial corporate leverage ratio increased by 5.3 percentage points to 173.7%, up from 168.4% at the end of 2024. The primary driver behind that was a surge in short-term loans and bill financing, rather than growth in medium- to long-term credit and bond financing. Therefore, debt expansion and leverage growth among n