

A Review of the Renminbi in 2019
The renminbi slid through the psychological barrier of seven to one US dollar this year but that failed to create panic in the market. Instead there was basic equilibrium. This article takes a look at the currency’s trajectory over much of the year and seeks to explain what happened and why.
The renminbi traced an uncertain path over much of 2019,at times falling through the key level of seven to one US dollar,and at times making convincing gains. The central parity rate against the US dollar rose a cumulative 2.0% in the first four months of the year,reaching 6.70 to the dollar at the end of February. However,the mid-rate lost 2.5% in May amid negative market sentiment,offsetting the gains of the previous months. The market rate weakened to more than 6.90 to the US unit and then lost ground again in June and July reflecting a volatile US dollar index and the restart of Sino-US trade talks after the meeting of the two countries’ presidents.
Yet,the US tactic of applying “maximum pressure” after the 12th round of trade negotiations helped weaken the renminbi again in August. The trading price and the mid-rate of the onshore renminbi against the US dollar slipped below seven to one. As of the end of the third quarter,the central parity rate was 7.0729 to the dollar and the closing market price was 7.1381. There had been a fall of 2.8% in the market rate from August 2 and a decline of 3.0% from the end of last year. As this article went to print in late November,the currency was still weaker than seven to the dollar.
Market Forces
But statistics show that the renminbi’s depreciation was the consequence of market forces and not a deliberate weakening of the currency by authorities to gain a competitive trade advantage. The US dollar index had risen 3.5% over the first three quarters of 2019. In that same period there was a drop of 2,097 basis points in the renminbi mid-rate. This should have decreased the renminbi central parity by more than one yuan,even without the weakness of the renminbi against the US dollar as implied in China’s central parity quotation mechanism (the central parity = the previous day’s closing price + the exchange rates of a basket of currencies + counter-cyclical factors). In fact,the mid-rate fell only about 0.2 yuan. Data from the China Foreign Exchange Trade System (CFETS) showed a 1.9% decline in the renminbi index after a rise over the first three quarters.
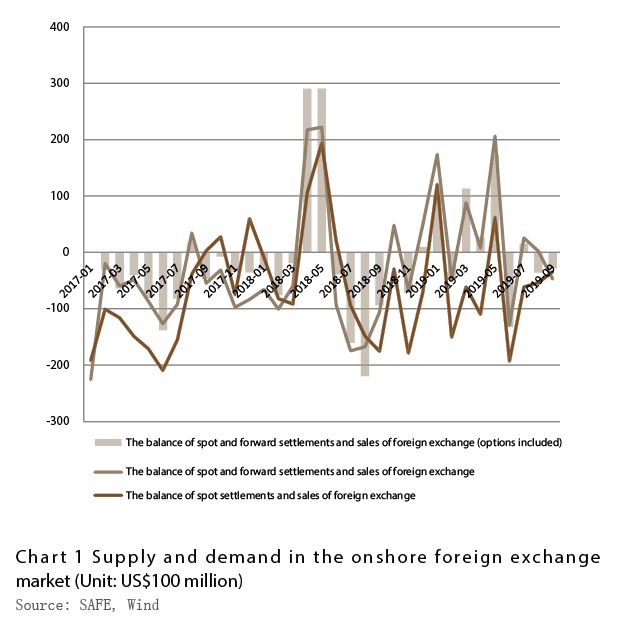
Supply and demand in the onshore retail foreign exchange market can be reflected by the banks’ spot and forward settlements and sales of foreign exchange — with options included. There was a combined surplus of US$18.3 billion in the transactions over the first three quarters of 2019,compared with a US$5.9 billion deficit in the same period last year. The deficit from spot settlements and sales of foreign exchange was US$48.2 billion,up 72% year on year.
Compared with the end of last year,net forward foreign exchange purchases by banks on behalf of customers decreased by US$76.2 billion,while the net options purchases with delta adjusted exposure on behalf of bank customers increased by US$9.7 billion. The two tallies of derivatives transactions raised foreign exchange supply by US$66.5 billion,up 200% from the same period last year.
Looking at spot settlements and sales without considering derivatives transactions would result in a misinterpretation of foreign exchange supply and demand. For example,in the third quarter of 2019,when the renminbi rate broke the seven to the dollar threshold,forward settlements and sales of foreign exchange (including options) by banks turned from a surplus of US$6.6 billion the previous quarter to a deficit of US$4.9 billion. The deficit of spot foreign exchange settlements and sales was US$15 billion,down 38% on a month on month basis. And the cumulative gain of the spot foreign exchange supply by forwards and options was US$10.1 billion,down 67% month on month (See Chart 1). It can be seen once again that after China's currency breached the seven to the dollar level,although demand for foreign exchange went up in the spot market due to increased hedging against forward purchases,there was still a basic equilibrium in the market.
Balance of Payments
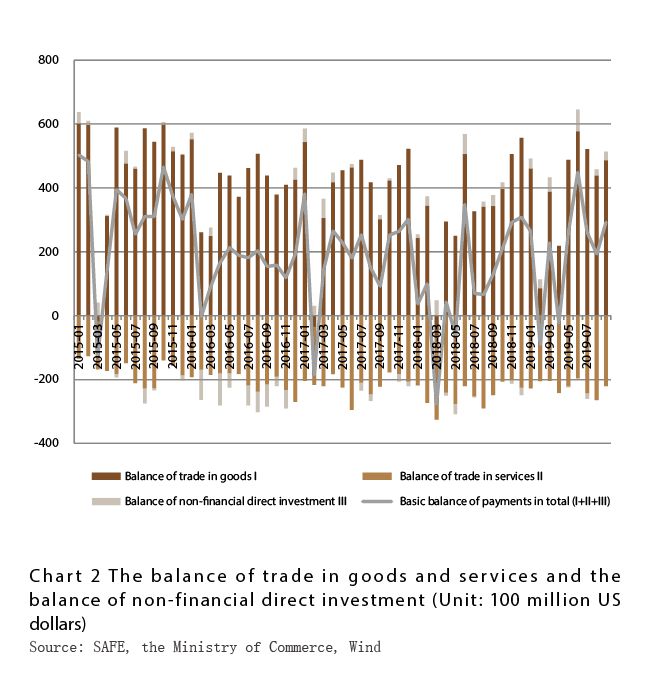
In the first three quarters of 2019 there was an increase in the balance of payments surplus. Exports fell 0.1% and imports slid 5.0% in dollar terms in the nine-month period,according to customs data. There was a surplus of US$298.4 billion,up 36.1%,3.3 percentage points higher than the growth rate in the first half of the year. The services trade deficit was US$129.1 billion,an estimated drop of 8%. Over the same period,the non-financial sector utilized US$100.8 billion in actual foreign direct investment,up 2.9% from the year before. Data from the Ministry of Commerce indicated that despite economic and trade frictions,China was still a hot spot for foreign investment.
Chinese enterprises also remained keen on “going global” despite growing protectionism. Outbound direct investment reached US$81 billion in the first nine months of the year,down only 1.5% from a year earlier. There was a surplus of US$19.8 billion in non-financial direct investment,up 52% year on year,though this was 27.9 percentage points lower than in the first half of the year.
The surplus on the basic balance of payments — the balance of trade in goods and services combined with the surplus of direct investment — was US$183.6 billion,an increase of 302% year on year. In the third quarter alone,the basic balance of payments surplus was US$74.6 billion,up 8% month on month and 182% year on year. This ensured that China’s foreign exchange market quickly regained stability after the renminbi breached the seven to the dollar level (See Chart 2).
Foreign Investment in Renminbi Financial Assets
In the first three quarters of 2019,foreign institutions increased their holdings of renminbi financial assets,but there was considerable volatility in stock market investments. Under the Stock Connect Program,which most importantly links mainland bourses with the Hong Kong stock exchange,China had net capital outflows for five months,and net capital inflows for the four months of January,February,June and September. In the first nine months of 2019 there was a cumulative net inflow of 28 billion yuan,though that was down 82.5% from the same period last year. As for bond investments,cross-border capital flows were stable